
Visual workspace for serious literature reviews
Research that feels connected. organized. clear. shareable. connected.
Papergraph turns papers, notes, and relationships into a focused whiteboard for research. Build a graph that helps you understand, not just store, your literature.
Used in research workflows at


Search and import
Import articles from the sources researchers already use.
Start with identifiers and formats you already have in your workflow, then turn them into connected nodes in seconds.


Core workflow
Build your research graph from a clean import flow.
Add articles with a single action. Import from DOI, arXiv or BibTeX and let each source become a node in a graph built for reasoning, not just storage.

Reasoning in structure
Connect related papers with explicit semantics.
Draw edges between papers, label the relationship, and make your interpretation visible. Citations, methodological overlap, or disagreement can all live directly on the graph.
Visual organization
Organize with tags and zones without losing clarity.
Group themes spatially, color-code topics, and filter your graph when you need to focus. The layout stays readable even as your corpus becomes more connected.
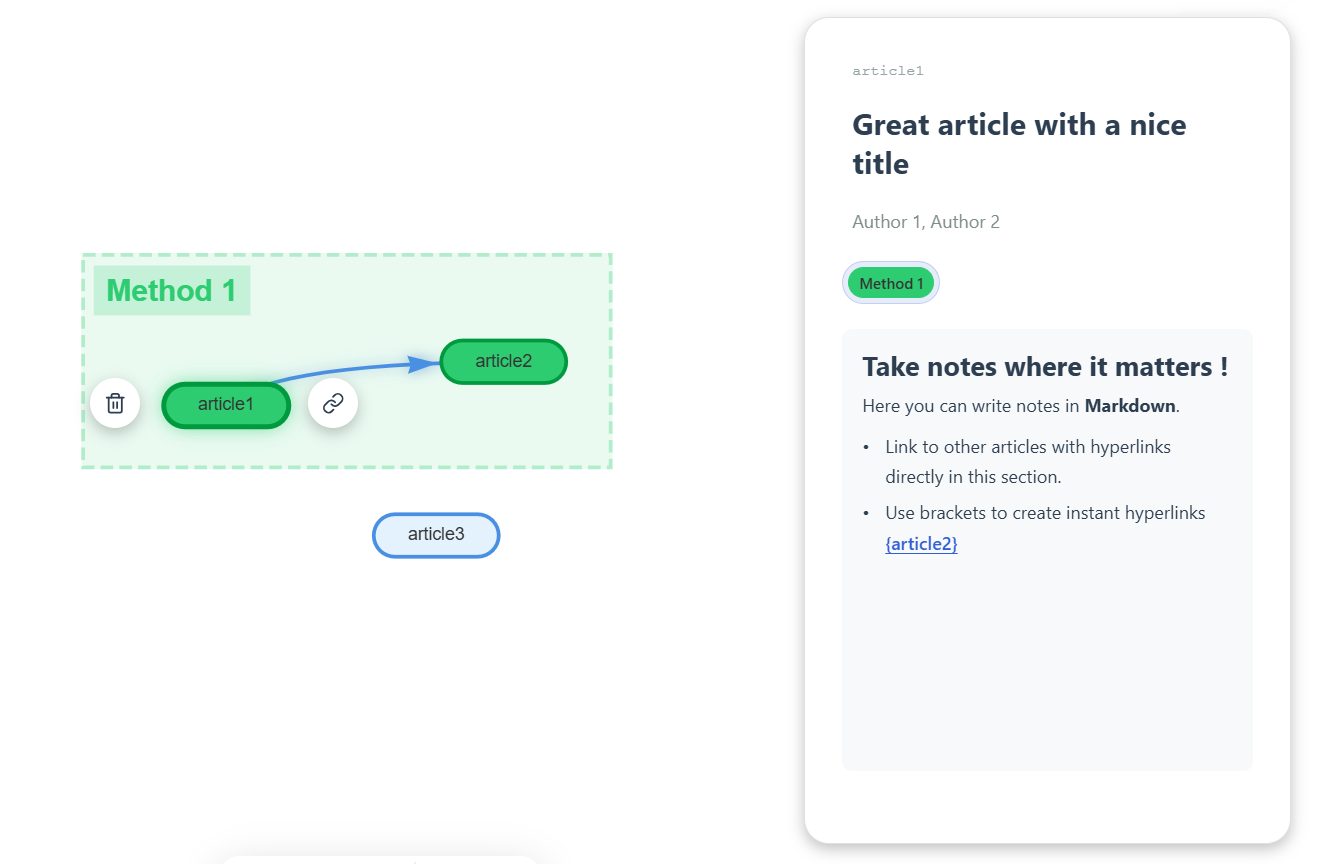
Markdown contextual notes
Write synthesis directly in the graph view.
Capture context where it belongs. Papergraph uses the same markdown note rendering from the editor to support headings, lists, links, and node citations directly alongside your graph.
Q&A
Questions people usually ask before starting.
A quick overview of what Papergraph is for, who it is built for, how access works, and how to help shape the product.
What is Papergraph for?
Papergraph is a visual workspace for literature reviews and research synthesis. It helps you import papers, connect them with labeled relationships, organize them spatially, and write notes in context so your graph supports reasoning, not just storage.
Who can access it?
Anyone can browse the public gallery page. To create projects, save work across devices, or manage your own workspace, you need an account. Shared project links can also give others access depending on how a project is published or shared.
Do I need an account to try it?
You can explore the gallery without signing in. If you want to build your own graph, save your projects, or use cloud-backed collaboration and sharing features, signing in is the right path.
What can I import into Papergraph?
Papergraph is designed around research-friendly sources and formats such as DOI, arXiv, and BibTeX. The goal is to get from identifiers and citation data to connected graph nodes with as little friction as possible.
Can I share work with other people?
Yes. Papergraph supports sharing and gallery-style publishing workflows so a graph can move beyond a private notebook. Depending on the project mode, collaborators or viewers may have read-only access.
How do I report a bug, ask for a feature, or contribute?
The best place is GitHub. If you spot a bug or want a feature, open an issue. If you want to contribute code, design, docs, or product feedback, fork the repository and open a pull request or start a discussion in an issue first.
Start mapping your research in minutes.
Create a project or browse the gallery for inspiration.